Understanding and measuring HTTP timings is like having a superpower in web development. It's like having a special ability that lets you see how computers talk to each other, either from your device to a server or between servers. It helps you find and fix problems that slow down your websites or apps. In this article, we’ll discover how to enhance HTTP response time in Node.js for faster websites and apps.
Before we delve into HTTP timings, let’s learn some of the basics to lay the groundwork for proper understanding.
The backbone of network communication, IP handles addressing and routing. It ensures the delivery of data packets from source to destination hosts across one or more IP networks.
This hierarchical naming system translates human-readable hostnames, crucial for web applications, into machine-readable IP addresses.
A rule that helps set up and maintain talks between computer programs on a network. It ensures reliable, ordered, and error-checked delivery of data between hosts over an IP network.
Cryptographic protocols providing communication security over a network. SSL, an older version, paved the way for TLS. Both use certificates to establish secure connections, with TLS being the more modern and secure choice.
Time spent resolving domain names to IP addresses. Each new domain triggers a full round trip for DNS lookup. No lookup is required if the destination is already an IP address.
The duration to establish a TCP connection between source and destination hosts. This involves a multi-step handshake process, managed by the operating system. If the TCP connection cannot be established, the OS-wide timeout prevails.
Time dedicated to completing a TLS handshake. This process involves exchanging authentication and keys to establish or resume secure sessions. Note that a TLS handshake doesn't occur with non-HTTPS requests.
The time spent waiting for the initial response. This duration encapsulates the latency of a round trip to the server, coupled with the time the server takes to process the request and deliver the response.
The time allocated to receiving the response data. The duration is influenced by both the size of the response data and the available network bandwidth.
For instance, if your DNS Lookup takes more time than anticipated, the problem could be related to your DNS provider or caching settings. And if the Time to First Byte is prolonged then you can quickly examine the latency between endpoints and assess the current server load.
Moreover, delayed Content Transfer may result from an inefficient response body, such as transmitting excessive data (unused JSON properties), or due to a sluggish connection.
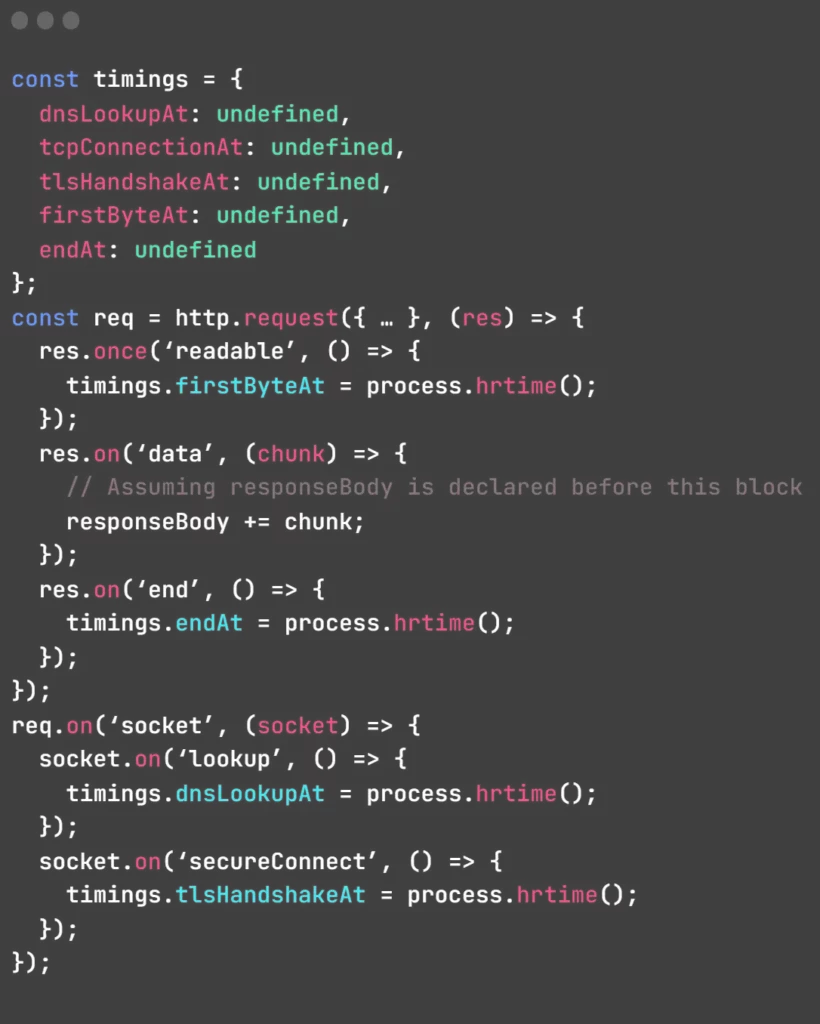
To check HTTP timings in Node.js, we must listen for particular requests, responses, and socket events. Here's a quick code snippet demonstrating how to do this in Node.js; this example concentrates solely on timings.
Example code for DNS Lookup
// Check if DNS lookup occurred (not an IP address)
const dnsLookup = dnsLookupAt !== undefined ? getDuration(startAt, dnsLookupAt) : undefined;
You can use the following code to check the TCP Connection
const tcpConnection = getDuration(dnsLookupAt || startAt, tcpConnectionAt);
The TLS Handshake only works with https protocol
// Check if TLS handshake occurred (HTTPS)
const tlsHandshake = tlsHandshakeAt !== undefined ? getDuration(tcpConnectionAt, tlsHandshakeAt) : undefined;
After the TLS handshake we wait for the server to send the First Byte
const firstByte = getDuration(tlsHandshakeAt || tcpConnectionAt, firstByteAt);
After the First Byte Content Transfer begins
const contentTransfer = getDuration(firstByteAt, endAt);
Now that we've learned how to measure HTTP timings with Node, let's have a look at some of the available tools. These tools can be valuable for comprehending your HTTP requests.
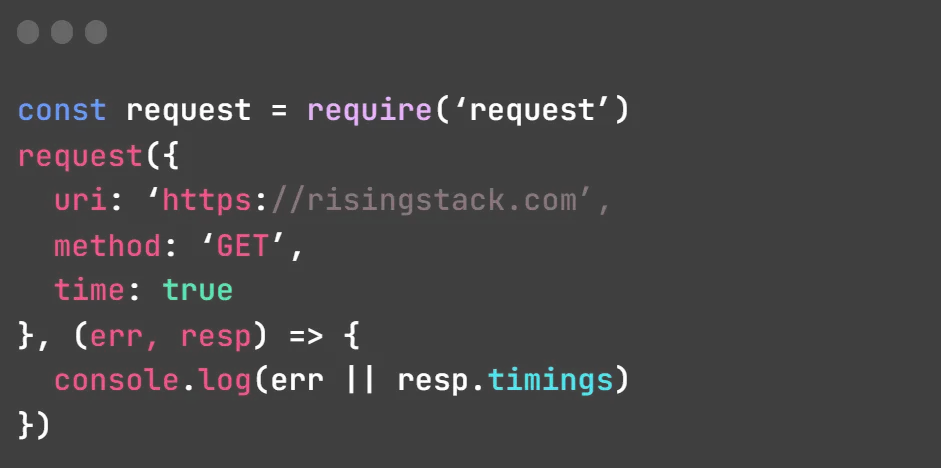
The widely-used request module comes equipped with a convenient feature for measuring HTTP timings. To activate this feature, use the time property.
You can use the technique of distributed tracing and display the HTTP timings visually on a timeline. This approach offers a holistic view of background processes, unveiling the actual cost of constructing distributed systems.
You can use the open tracing-auto library for successfully distributed tracing.
Exploring HTTP Timings in Node.js can unveil performance bottlenecks, and fortunately, the Node ecosystem offers excellent tools for extracting these crucial metrics from your application. So, use the tools or coding techniques to improve the response time of your node.js apps.